
Risk-Adjusted NPV, and Why Every Other Method Breaks on Clinical Risk
Risk-adjusted NPV weights each cash flow by the chance a drug program survives to it. Single-rate shortcuts break because clinical risk resolves in steps at phase gates.
 By Peleg Chevion, Managing Partner
9 min read · Life Sciences and Healthcare
By Peleg Chevion, Managing Partner
9 min read · Life Sciences and Healthcare
In this note06 · 9 min
Risk-adjusted net present value prices a drug candidate by weighting each cash flow by the probability that the program survives to spend or earn it, then discounting at a rate that carries only market risk. Every single-rate shortcut breaks on clinical risk because that risk arrives in binary steps at phase gates rather than as a smooth annual decay, and a rate calibrated today is wrong after the next readout.
01The Method and Its Origin
The canonical statement of the method for biotechnology is Stewart, Allison and Johnson, "Putting a price on biotechnology," Nature Biotechnology 19, 813–817 (2001). The paper's premise is that many bioentrepreneurs incorrectly estimate the value of their technology by failing to account adequately for the cost, risk and time inherent in product development, and it was published with a spreadsheet for calculating the rNPV. Those three words, cost, risk and time, are the whole model.
The formula is short. For each cash flow CF(t) at time t, multiply by the cumulative probability p(t) that the program is still alive when that cash flow occurs, then discount: rNPV = Σ [ p(t) × CF(t) / (1 + r)^t ]. Technical risk lives in p(t). The rate r carries only the systematic risk an investor would demand on any comparable asset, so it is far lower than the rates applied to early-stage biotechnology when risk is folded into the rate instead.
One structural feature does most of the work. A Phase III budget is weighted by the probability of reaching Phase III, so the model spends money only in the worlds where the program survives. Abandonment is built in: a program that fails Phase II never writes the Phase III check, and the valuation knows it.
02The Probability Inputs
The probabilities should come from a dataset the reader can open. A public dataset that can be opened and checked is BIO, Informa Pharma Intelligence and QLS Advisors, Clinical Development Success Rates and Contributing Factors 2011–2020 (February 2021), which recorded 12,728 clinical and regulatory phase transitions from 9,704 development programs across 1,779 companies in the Biomedtracker database. It defines a phase success rate as the number of programs that advanced to the next phase divided by the number that advanced or were suspended.
For all indications, the report prints a Phase I transition success rate of 52.0% (n=4,414), Phase II of 28.9% (n=4,933), Phase III of 57.8% (n=1,928) and NDA/BLA approval of 90.6% (n=1,453). Their product, the likelihood of approval from Phase I, is 7.9%. The same report measures an average of 10.5 years from Phase I to approval: 2.3 years in Phase I, 3.6 in Phase II, 3.3 in Phase III and 1.3 at the regulatory stage.
Three caveats from the report itself belong in any model built on it. Phase I rates may benefit from delayed reporting or omission bias, because some larger companies may not treat a failed Phase I program as material. The 90.6% regulatory rate counts eventual approval after resubmissions, not success on the first review.
The spread by disease area is wide: likelihood of approval from Phase I runs from 23.9% in Hematology to 3.6% in Urology, with Oncology at 5.3%. Choosing the row is a valuation decision, not a formality. The report also records one internal inconsistency worth noticing: its text gives Oncology's Phase III rate as 47.5%, while its Figure 2 table and Figure 4 chart print 47.7%. This essay uses the table.
The same study used machine-learning models to rank what drives success and found the top contributing factors to be disease indication, target, modality and drug novelty. Those factors are the inputs that AI in diligence can use to refine an asset-specific probability. The rNPV is the structure that consumes the refined number, and it is only as good as the probability fed into it.
03The Worked Valuation
The asset is hypothetical: a candidate about to enter Phase I. Probabilities are the BIO all-indications row exactly as printed. Timing follows the BIO average phase durations, used here as an assumption. The costs, the value of the marketed product at approval and the 10% discount rate are assumptions chosen for illustration, not estimates for any real program. Each spend is assumed to occur at the start of its stage, and the product's post-launch cash flows are collapsed into a single value of $3,000 million at approval.
| Stage cash flow | Stage success rate (BIO, all indications, as printed) | Probability the cash flow occurs | Cash flow, $M (assumption) | Year (assumption) | Discount factor at 10% | Risk-adjusted present value, $M |
|---|---|---|---|---|---|---|
| Phase I spend | 52.0% | 100.00% | −25.0 | 0.0 | 1.0000 | −25.0 |
| Phase II spend | 28.9% | 52.00% | −60.0 | 2.3 | 0.8032 | −25.1 |
| Phase III spend | 57.8% | 15.03% | −250.0 | 5.9 | 0.5699 | −21.4 |
| NDA/BLA submission spend | 90.6% | 8.69% | −5.0 | 9.2 | 0.4161 | −0.2 |
| Approval: value of the marketed product | Likelihood of approval 7.9% | 7.87% | +3,000.0 | 10.5 | 0.3676 | +86.8 |
| Risk-adjusted NPV | +15.1 |
Each row multiplies three numbers. The probability column is the product of the stage success rates before that cash flow: 52.0% × 28.9% = 15.03% for the Phase III spend, and 52.0% × 28.9% × 57.8% × 90.6% = 7.87% at approval, which rounds to the report's printed 7.9%. The discount factor is 1 / 1.10^t, with t in years. Probabilities are shown to two decimals, discount factors to four and values to one decimal; every cell was computed unrounded.
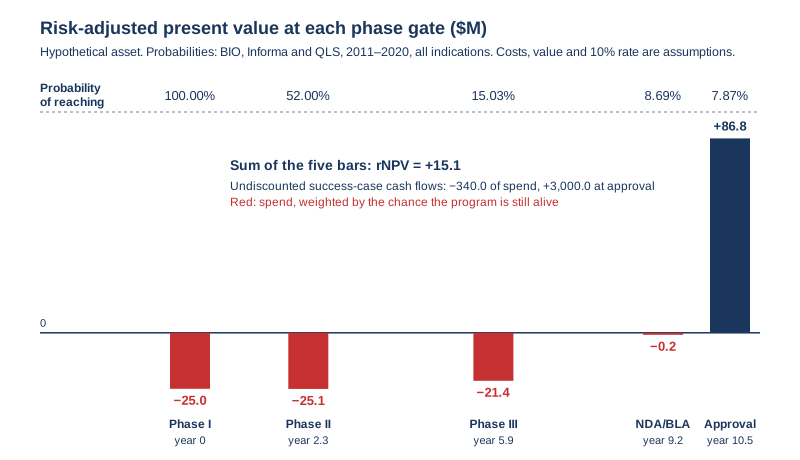
The result is small and positive: $71.6 million of risk-adjusted spend against $86.8 million of risk-adjusted value, for an rNPV of $15.1 million. The undiscounted program spends $340 million to reach a $3,000 million prize, and the method says the bet is worth $15.1 million today.
04The Single-Rate Alternatives
The first alternative is the success-case discounted cash flow: the same cash flows, discounted at 10%, with no probabilities. It returns $885.1 million, more than fifty times the rNPV, because it values a program that succeeds 7.87% of the time as if it always succeeds.
The second is the single high rate: discount the success-case cash flows at a rate high enough to absorb the risk. The rate that reproduces this asset's rNPV exactly is 37.2%. At day zero the two methods agree by construction, but the agreement is an offset of errors. The single rate gives the approval value a present value of $108.0 million against the rNPV's $86.8 million, and charges the Phase III spend at $38.6 million against $21.4 million. It overstates both the prize and the cost, and the two misstatements happen to cancel.
The offset does not survive a readout. When Phase I succeeds, the rNPV of the asset at the start of Phase II is $96.1 million; the same 37.2% rate rolled forward gives $83.1 million. When Phase II then succeeds, the rNPV at the start of Phase III is $761.3 million; the single rate gives $447.5 million, about 41% too low. Clinical risk resolves in steps, and a constant rate spreads it smoothly over time. An analyst who keeps the rate after a positive readout undervalues the asset, and one who resets the rate is rebuilding the rNPV without showing the probabilities.
The third is the comparable or the multiple. A pre-approval asset has no revenue to multiply, and a comparable transaction embeds another asset's indication, phase and probability. The table below holds this asset's costs, timing, value and rate constant and changes only the BIO row. The valuation moves from negative to more than ten times the base case.
| BIO row (as printed) | Phase I | Phase II | Phase III | NDA/BLA | Likelihood of approval, printed | Likelihood of approval, computed | rNPV, $M |
|---|---|---|---|---|---|---|---|
| Oncology | 48.8% | 24.6% | 47.7% | 92.0% | 5.3% | 5.27% | −7.6 |
| All indications | 52.0% | 28.9% | 57.8% | 90.6% | 7.9% | 7.87% | +15.1 |
| Hematology | 69.6% | 48.1% | 76.8% | 93.1% | 23.9% | 23.94% | +157.2 |
Holding timing constant across rows is itself a simplification, since the report measures different phase durations by disease area. The point stands: the probability input moves this valuation more than any other assumption, which is why it belongs in plain view rather than buried inside a discount rate.
05The Fair Value Frame
Where an investment must be reported at fair value, the governing U.S. GAAP authority is FASB Accounting Standards Codification Topic 820, Fair Value Measurement. Under ASC 820-10-35-24A, the objective of a valuation technique is to estimate the price at which an orderly transaction to sell the asset would take place between market participants at the measurement date under current market conditions. The income approach, described in ASC 820-10-55-3F, converts future amounts to a single current, discounted amount, and ASC 820-10-55-4 through 55-20 describe two present value techniques: a discount rate adjustment technique and an expected present value technique.
The mapping is direct. The single high rate applied to success-case cash flows is the discount rate adjustment technique, which ASC 820-10-55-10 describes as using a single set of contractual, promised or most likely cash flows. The rNPV is, in structure, Method 2 of the expected present value technique in ASC 820-10-55-16: probability-weighted cash flows discounted at an expected rate of return, which models such as the capital asset pricing model can be used to estimate. The same paragraph states that the rate in the discount rate adjustment technique, which relates to conditional cash flows, is likely to be higher than the Method 2 rate. The worked example shows the size of that gap: 37.2% against 10%.
ASC 820-10-55-6 adds the discipline that matters most in practice. Discount rates should reflect assumptions consistent with those inherent in the cash flows, to avoid double counting or omitting risk. The Codification's own example is a loan: a rate that reflects uncertainty about defaults should not be applied to probability-weighted cash flows that already reflect that uncertainty. The same logic applies to clinical risk, and an rNPV discounted at a venture-style rate counts it twice. The cash flows and rates must also reflect assumptions that market participants would use, so an industry dataset is a starting point that must be defended as a market participant input, not an entity-specific hope.
Finally, ASC 820-10-35-38 states that the fair value hierarchy prioritizes the inputs to valuation techniques, not the techniques, so a present value measurement can fall in Level 2 or Level 3 depending on its significant inputs. Probabilities of success, trial budgets and a launch forecast for a private asset are not observable market prices, which in practice places an rNPV of a private clinical asset in Level 3. LeverVenture's own position, stated as a practice rather than a requirement of any standard, is to lead with the rNPV in biopharma and therapeutics diligence, show the probability row and its source on the face of the model, and use a single-rate calculation only as a cross-check. An earnings screen such as the positive EBITDA in the usual growth equity profile has nothing to measure in a clinical-stage therapeutic that cannot sell a product before approval, so the probability row has to carry that work.
06Frequently asked questions
What is the difference between rNPV and a standard NPV?
A standard NPV discounts one set of cash flows at one rate. An rNPV first multiplies each cash flow by the cumulative probability that the program survives to that point, then discounts at a rate that reflects only market risk. In the worked example, the same cash flows produce $885.1 million as a success-case NPV and $15.1 million as an rNPV.
Where do the probabilities of success come from?
The common public starting point is the BIO, Informa Pharma Intelligence and QLS Advisors study of 2011–2020 phase transitions, which prints success rates by phase and by disease area. For all indications it reports 52.0%, 28.9%, 57.8% and 90.6%, for a 7.9% likelihood of approval from Phase I. An asset-specific model should justify any departure from the relevant row.
Is rNPV consistent with fair value under ASC 820?
In structure, yes. ASC 820-10-55-16 describes Method 2 of the expected present value technique as discounting probability-weighted cash flows at an expected rate of return, which is how an rNPV is built. The inputs must still reflect market participant assumptions, and the discount rate must not count the clinical risk a second time.
Nothing in this piece is investment, legal, tax or accounting advice, and nothing in it is an offer to sell or a solicitation of an offer to buy any security.
Three decades of operational leadership across agriculture, pharmaceuticals, biotechnology, climate, food and defense. He has spent that career doing the work this seat requires: strategic partnerships, licensing and business development, executed transaction by transaction. He sits with a company as an operating partner and a growth strategist rather than as a name on its board. A corporate finance and intellectual property attorney, an INSEAD MBA, and a former Air Force officer in aerospace. He also brings strong private equity experience.