
The J-Curve Is Different in Life Sciences, and Allocators Should Price It
In life sciences, regulatory clocks set the J-curve. Drug approval takes 10.5 years on average from Phase I, so the trough runs longer and reported value moves in steps.
 By José Vasquéz, Managing Partner
10 min read · Growth Equity
By José Vasquéz, Managing Partner
10 min read · Growth Equity
In this note06 · 10 min
The private equity J-curve is usually explained by fees and deployment pace. In life sciences, regulatory clocks set its shape. A drug candidate takes 10.5 years on average to move from Phase I to approval, and a cleared device still has to win coverage. The trough runs longer, and reported value moves in steps, not along a slope. Underwriting the generic curve misprices both the wait and the marks.
01The Shape of the Curve
The clearest public picture of the curve comes from vintage-year benchmark tables. In the Cambridge Associates US venture capital benchmark statistics as of September 30, 2019, funds of the 2017 vintage had distributed 0.02 times paid-in capital while reporting total value of 1.21 times. Funds of the 2014 vintage had distributed 0.22 times against total value of 1.72 times. The companion US private equity tables, under the legacy definition that includes buyout and growth equity funds, follow the same order: 0.03 times distributed for 2017 and 0.35 times for 2014. In both series, among the vintages from 2005 through 2017, only those of 2010 and earlier had returned more than paid-in capital in cash.
Two multiples carry the story. Distributions to paid-in capital (DPI) counts only cash returned. Total value to paid-in capital (TVPI) adds the residual value the manager still reports. The gap between them is the J-curve as a limited partner lives it: value is reported years before it is returned. The same tables caution that most funds take at least six years to settle into their final quartile ranking, and that before then they typically rank in two or three other quartiles. An interim ranking is a forecast, not a result.
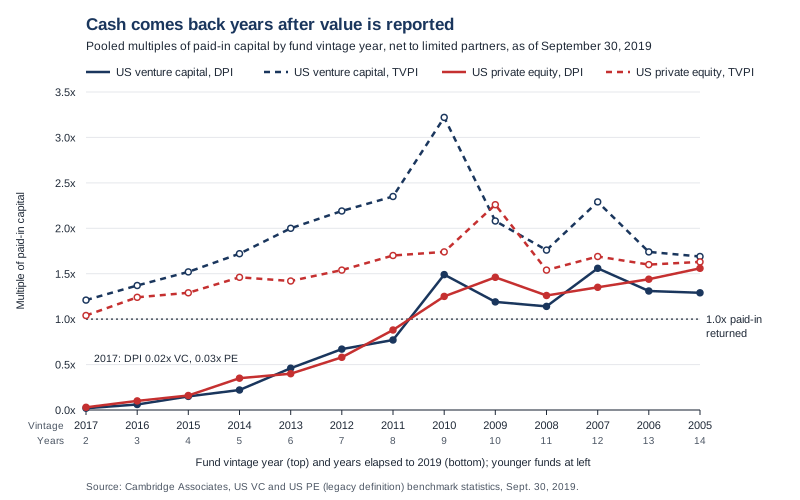
These tables do not separate life sciences funds from the rest. Cambridge Associates reports company-level gross returns for a health care and biotech group by year of initial investment, but in these reports its fund-level cash multiples by vintage are not broken out by sector. What follows is therefore a structural argument built from regulatory timelines and deal data, not a sector benchmark. The figure shows the generic curve, and the sections below explain why a life sciences curve departs from it.
02The Regulatory Clock
A software company can, in principle, change its price, its customer count or its costs in any quarter. A therapeutics company cannot sell its product until a regulator acts, and the regulator acts on a timetable set by statute, by negotiated performance goals and by the time clinical trials take. The BIO, Informa Pharma Intelligence and QLS study of 9,704 development programs from 2011 to 2020 found an average of 10.5 years from Phase I to regulatory approval: 2.3 years in Phase I, 3.6 in Phase II, 3.3 in Phase III and 1.3 at the regulatory stage. Only 7.9 percent of candidates entering Phase I reached approval, and only 28.9 percent of Phase II candidates advanced to Phase III.
Those figures set the depth and the length of the trough. A fund that backs a Phase I asset in its second year and follows the average path would not see approval until roughly year twelve, late in the life of a fund with a ten-year term or after it. Along the way, the asset's value does not drift. It jumps at each readout, up or down, because each readout changes the probability that the product ever reaches the market. Reported value in a clinical-stage portfolio is a sequence of binary events, and the largest of them, Phase II, sits in the middle of a fund's life.
Devices and diagnostics run on shorter clocks, but they are clocks all the same. Under 21 U.S.C. § 360e(d)(1)(A), FDA must act on a premarket approval application within 180 days of receipt, unless the agency and the applicant agree to a longer period. Under 21 U.S.C. § 360(n)(1), FDA must review a premarket notification under section 510(k) and make its determination within 90 days of receiving it. For drugs, the PDUFA VII performance goals commit FDA to act on 90 percent of standard new molecular entity NDAs and original BLAs within 10 months of the 60-day filing date, and on 90 percent of priority submissions within 6 months of that date.
Clearance is not revenue. For Medicare, the Transitional Coverage for Emerging Technologies final notice, 89 Fed. Reg. 65724, offers a faster national coverage path for certain Breakthrough Devices. CMS stated that, on current resources, it does not anticipate accepting more than five candidates into the pathway each year, and that transitional coverage may last five or more years while evidence gaps are addressed. A device company can therefore hold an FDA authorization and still wait for the payer decision that turns it into a revenue line. That wait sits inside the investor's J-curve.
| Event | Authority or source | Clock or rate | Effect on the curve |
|---|---|---|---|
| Drug development, Phase I to approval | BIO, Informa and QLS, 2011 to 2020 programs | 10.5 years on average; 7.9 percent of Phase I candidates approved | Lengthens the trough past a typical investment period; early marks carry low probability-weighted value |
| Phase II to Phase III transition | BIO, Informa and QLS, 2011 to 2020 programs | 28.9 percent advance; 3.6 years in Phase II on average | The largest single step change in reported value, usually mid-fund |
| Standard NME NDA or original BLA review | PDUFA VII performance goals | 90 percent acted on within 10 months of the 60-day filing date | Places a dated decision point about a year after submission |
| Priority NME NDA or original BLA review | PDUFA VII performance goals | 90 percent acted on within 6 months of the 60-day filing date | Pulls the decision point forward by about four months |
| Device premarket approval | 21 U.S.C. § 360e(d)(1)(A) | 180 days after receipt, unless extended by agreement | A statutory review period, not a guarantee of approval |
| Device premarket notification, 510(k) | 21 U.S.C. § 360(n)(1) | 90 days after FDA receives the report | The shortest regulatory clock in the table |
| Medicare coverage for Breakthrough Devices | CMS final notice, 89 Fed. Reg. 65724 | No more than five candidates anticipated each year; transitional coverage may last five or more years | Separates authorization from reimbursed revenue |
| Contingent consideration at exit | SRS Acquiom data, reported by BioSpace | About $9.0 billion paid of $95.1 billion potential, 342 deals signed 2008 to 2025 | Turns one exit into several distributions over years, many of which never arrive |
03Exit Mechanics and Contingent Consideration
The right-hand side of the curve is also different. A life sciences sale often pays part of the price at closing and the rest only if later milestones are met: an approval, a launch, a sales threshold. SRS Acquiom's data on private-target life sciences acquisitions, as reported by BioSpace, show that of $95.1 billion in potential milestone payments across 342 deals signed from 2008 to 2025, about $9 billion had been paid. In biopharma deals, 19 percent of the milestone value that had come due by mid-2025 was paid, and most of those payments arrived in the first one to two years after closing.
For the allocator, the consequence is mechanical. An announced exit is not a single distribution. The closing payment moves DPI. Unpaid milestones are not distributions, and to the extent a manager assigns them value, they sit in residual value and lift TVPI without lifting DPI. The exit, in other words, can widen the gap the J-curve describes before it closes it. A disciplined manager discloses the closing proceeds and the contingent amount separately and explains how the contingent amount is valued.
04The Growth Equity Entry Point
Where an investor enters the regulatory sequence determines how much of the trough it buys. Early-stage venture capital in therapeutics usually enters before the binary steps and owns most of them. Growth equity, which takes minority positions in companies that already have products and revenue, enters after the largest steps have resolved. The authorization clock has run. What remains is commercial: coverage, coding, contracting and adoption. That curve is shallower, but it is not flat, because the coverage and adoption clocks described above still govern when revenue arrives.
That is the position LeverVenture takes across its five sectors: Biopharma & Therapeutics, Diagnostics & Precision Medicine, Devices & Robotics, Digital Health & Delivery, and Longevity & Neuro. AI accelerates each of them, but it does not move a statutory review period or a payer decision. Underwriting starts from the clocks a company still has to clear, not from the multiple an earlier investor reported.
Fund financing can hide the curve without changing it. The Institutional Limited Partners Association's June 2020 guidance on subscription lines of credit recognizes that these facilities have valid uses, including the smoothing of cash flows and the flattening of the J-curve, and recommends that managers report net IRR with and without the facility.
The same guidance cites a Cobalt analysis of 498 funds in which delaying the first cash flow by up to one year raised IRR for funds with TVPI above 1.0 times, with a median increase of 206 basis points by year three that fell to 35 to 45 basis points by the end of fund life. A borrowed early quarter improves the rate of return. It does not bring the approval date any closer.
05Pricing the Curve
An allocator who accepts that the life sciences curve is longer and moves in steps can price it directly. The method has six parts.
- Underwrite DPI by fund age. Compare a fund's DPI with the benchmark DPI for its vintage at the same age, and treat interim IRR as provisional until the fund has had about six years to settle, which is the period the Cambridge Associates tables identify.
- Map each holding to its next clock. For every material position, name the pending regulatory or coverage event, the authority that governs it and the date it can resolve. A portfolio with three Phase II readouts in one year carries a different risk from one with three PDUFA dates.
- Request performance with and without fund leverage. The ILPA Performance Template guidance, first released in January 2025, calls for net IRR and TVPI both with and without the impact of fund-level subscription facilities. Life sciences funds should report both.
- Separate contingent consideration from realized proceeds. Ask how much of reported value is unpaid milestones, and how the manager values them.
- Measure against public markets on matched cash flows. A public market equivalent, such as the Cambridge Associates modified PME used in the same benchmark tables, buys and sells a public index on the fund's own cash flow schedule. That is the cleanest way to ask whether the wait earned an illiquidity premium.
- Pace commitments for the longer trough. Capital that is called and not returned stays out longer in a life sciences program, so the planning model should assume a later DPI crossover than a generalist program assumes.
None of this argues against the sector. It argues for building the clocks into the price. The clocks are public, the review periods are written into statute and agency commitments, and the exit mechanics are visible in deal data. An allocator who builds them into the underwriting model will be less surprised by the curve and better placed to judge which managers have earned the wait.
06Frequently asked questions
Why is the J-curve longer in life sciences than in other private markets?
Because product revenue waits on regulators and payers. Drug candidates averaged 10.5 years from Phase I to approval in the 2011 to 2020 BIO, Informa and QLS data, device reviews run on statutory periods of 90 or 180 days, and Medicare coverage for a new device can require a separate national coverage process after FDA authorization. Distributions cannot arrive before those clocks run.
Does a subscription line of credit remove the J-curve?
No. A subscription line delays capital calls, which can raise early IRR, but it does not move a clinical readout or a regulatory decision. ILPA's 2020 guidance recommends reporting net IRR with and without the facility, and its 2025 Performance Template guidance extends that to TVPI.
How should an allocator compare a young life sciences fund with a benchmark?
Compare DPI and TVPI with the same vintage at the same age, treat rankings as provisional for about six years, separate unpaid milestone value from cash already distributed, and test the result against a public market equivalent built on the fund's own cash flows.
Nothing in this piece is investment, legal, tax or accounting advice, and nothing in it is an offer to sell or a solicitation of an offer to buy any security.
Former Chairman of JumpStart Inc. He has founded, scaled and exited companies across media, nutrition, real estate and human-resources technology, and owned the revenue line in every one of them. What he brings to a position is that operating experience at scale, investment acumen, an advanced diligence capability, and technology and artificial-intelligence expertise. He invests the way he operated: inside the business, on the plan, alongside the management team.