Growth Equity in Life Sciences: 2026 Market Study
Growth equity is absorbing a growing share of life sciences and healthcare capital. This market study breaks down the data, the five sectors in play, and where the financing gap actually sits.
 By José Vasquéz, Managing Partner
15 min read · Market Analysis
By José Vasquéz, Managing Partner
15 min read · Market Analysis
In this note07 · 15 min
- The market in numbers
- Where growth equity sits between venture and buyout
- Why life sciences and healthcare, specifically
- AI as an accelerant, not a category
- Where the market is inefficient: the mid-market growth equity gap
- What this means for allocators evaluating healthcare growth equity
- Frequently asked questions
Two figures frame the capital market that life sciences and healthcare companies face in 2026. US startups raised more than $400 billion in the first half of the year, surpassing every previous full-year total on record and already exceeding all of 2025. Healthcare private equity, meanwhile, closed 2025 with a record high in global deal value. Growth equity sits between those two figures. In this sector it is also the least directly measured part of private capital and, for one specific band of companies, the least adequately supplied with capital that brings operating capability alongside it.
This study sets out what the 2025 and 2026 data actually show, where growth equity fits between venture and buyout, how capital is organizing itself across life sciences and healthcare, where AI changes the diligence question, and where the market leaves a structural gap. One caveat belongs at the start. None of the public benchmarks used here breaks out life-sciences-only growth equity as its own series. Most of the numbers below describe the venture and buyout markets on either side, and the argument about the middle is built from those edges.
01The market in numbers
Start with venture. The PitchBook-NVCA Venture Monitor for the second quarter of 2026 reports that the overwhelming majority of invested capital flowed to AI companies and to financings of $100 million or more. Fundraising rebounded, with venture firms raising nearly as much capital through June as in all of 2025, though commitments remained concentrated among a small group of established managers. Exit activity improved in the quarter as IPOs and M&A accelerated. That recovery is uneven: our State of Growth Equity research finds roughly 1,200 venture-backed unicorns worldwide still sitting with no clear exit path and the listing window effectively closed to most of them.
Read carefully, the headline describes concentration more than abundance. A record half-year total dominated by AI and nine-figure rounds says little about whether a diagnostics company with $15 million of revenue can raise a $20 million round on reasonable terms. The aggregate rose; the typical company's access to capital did not necessarily rise with it. We covered the mechanics of that divergence in our analysis of the venture market reset and what it means for growth equity.
Now buyouts. Bain's Global Healthcare Private Equity Report 2026 found that healthcare private equity deal count in 2025 was the second-highest annual total on record, with strength across all deal sizes. Bain estimates disclosed deal value above $190 billion, surpassing the previous high set in 2021, across an estimated 445 buyouts.
For anyone tracking healthcare investment trends, the segment detail matters more than the total:
- Biopharma: estimated deal value rose to $80 billion from $55 billion in 2024.
- Provider and related services: deal value jumped 57% to an estimated $62 billion.
- Medtech: deal value nearly doubled to an estimated $33 billion, on an estimated 88 deals.
- Healthcare IT: deal value within the provider segment doubled to an estimated $32 billion, and healthcare IT accounted for nearly 20% of healthcare transactions in 2025, compared with 15% in 2021.
Be precise about what these figures count. Bain's healthcare series tracks buyouts. It is the right barometer for sponsor appetite, pricing and exit routes, but it does not measure minority growth capital, just as the venture series does not measure it from the other direction. Growth equity is the connective tissue between the two: capital that follows companies with working products and real revenue, rather than making first bets or buying control. Its size in this sector has to be inferred from the edges, not read off a chart.
02Where growth equity sits between venture and buyout
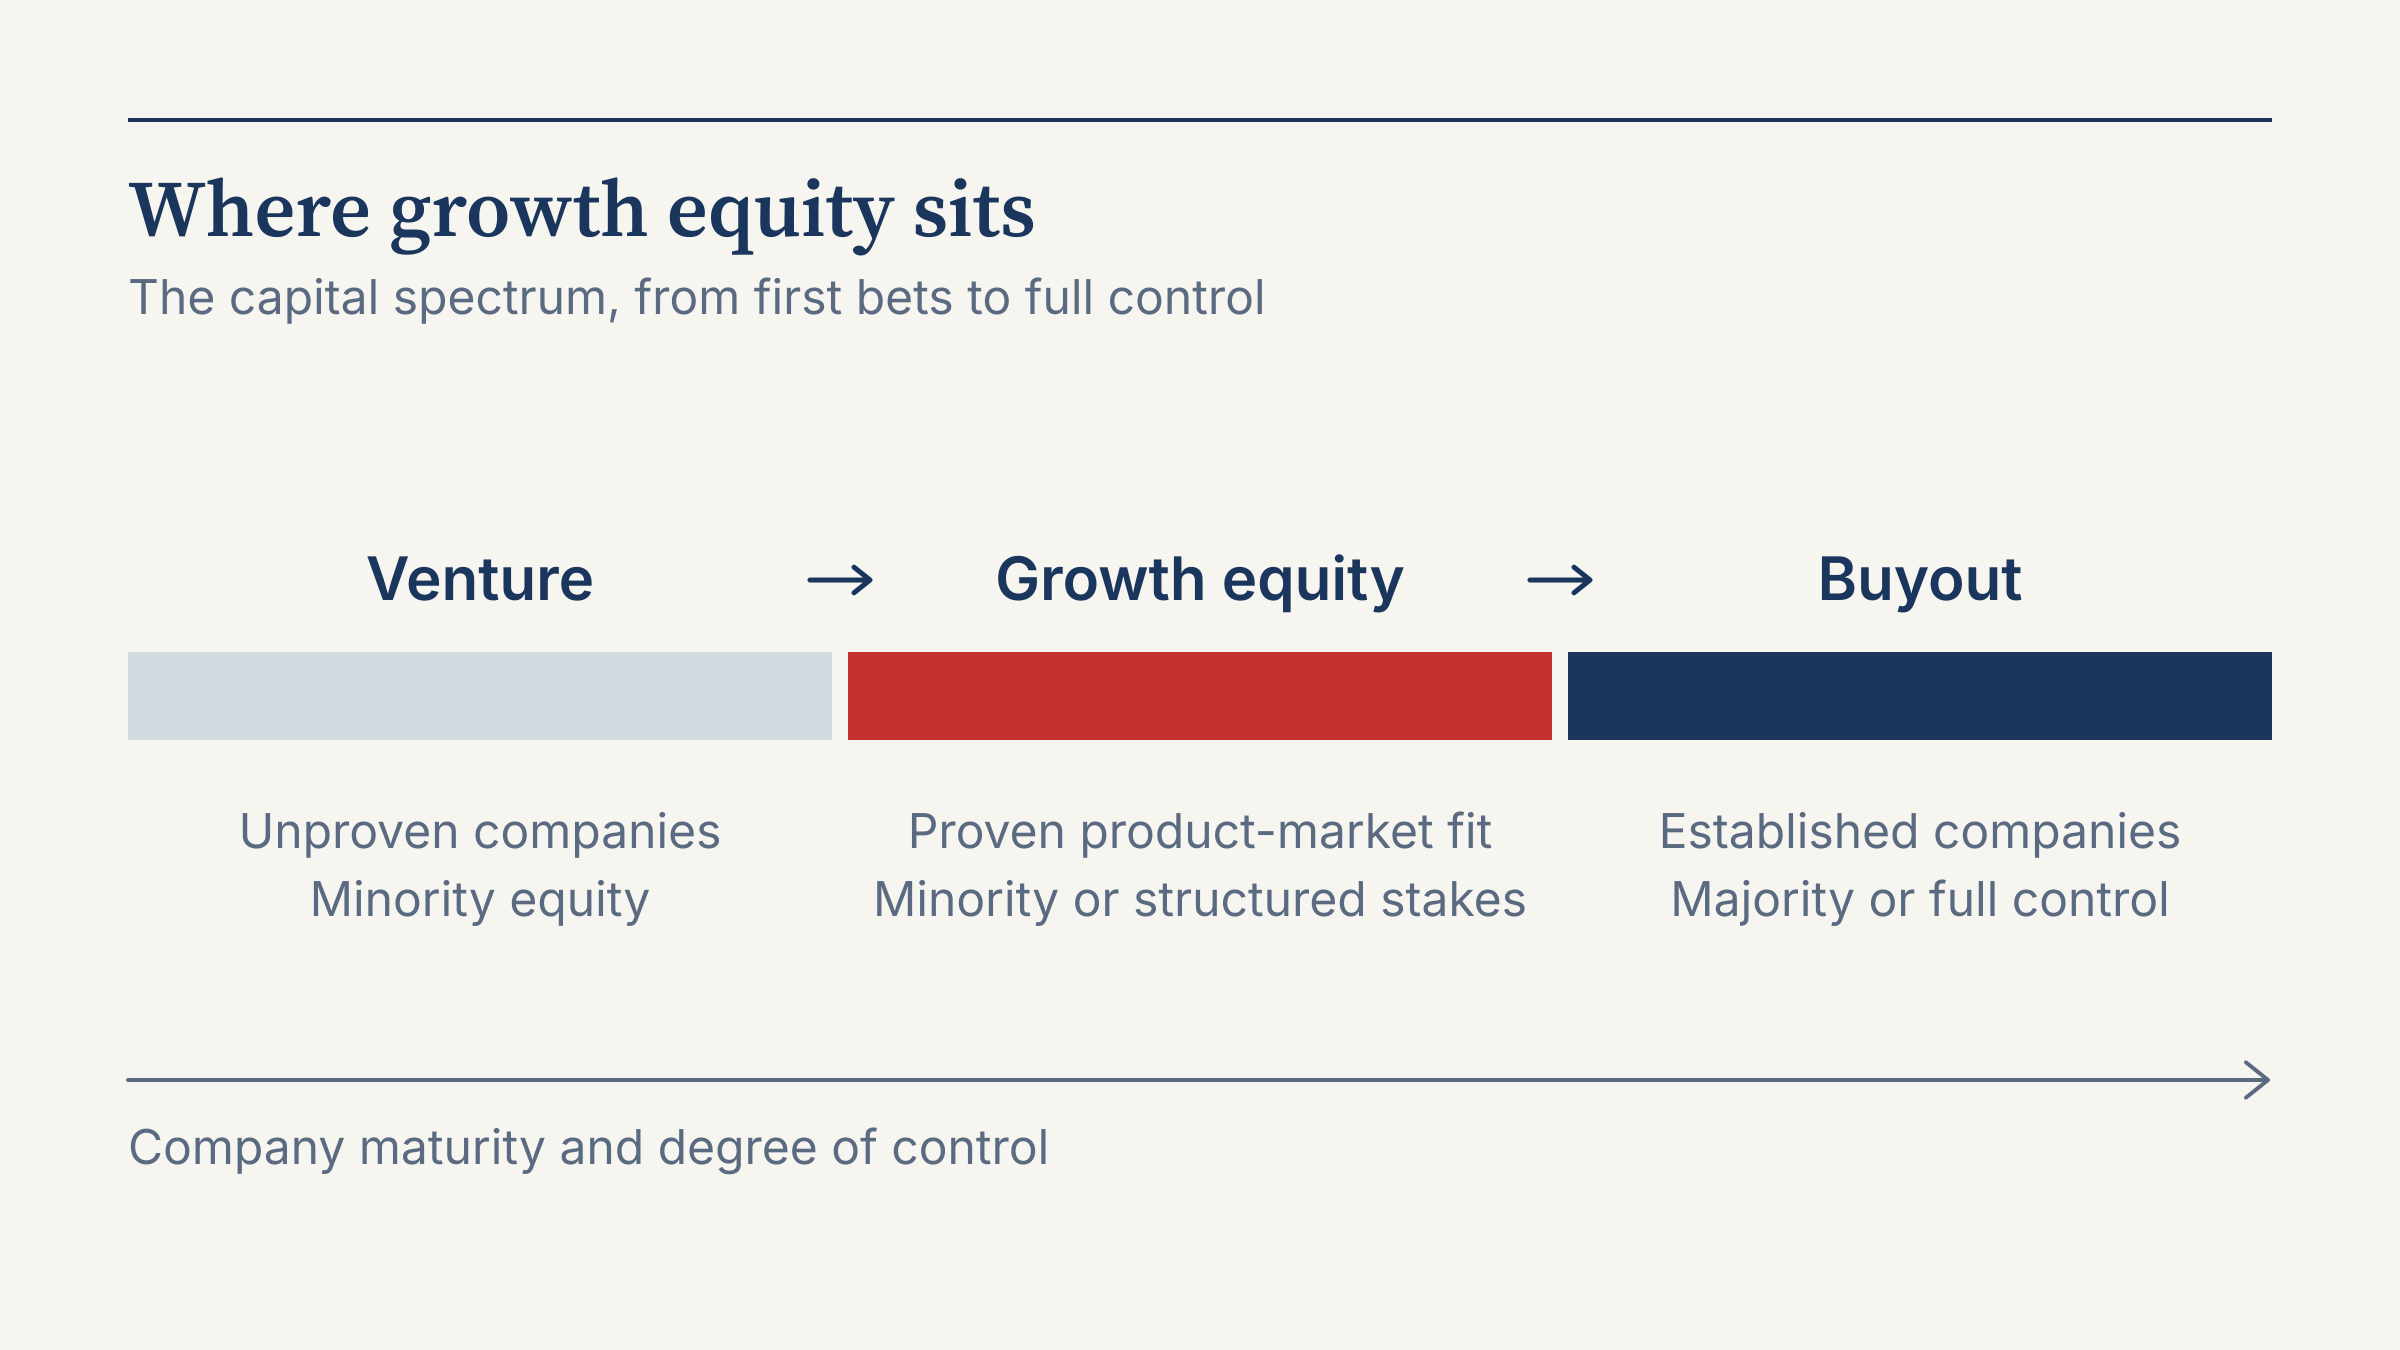
Growth equity funds companies that have passed product-market fit and generate meaningful revenue, often profitably or close to it. The company is too proven to be priced like a venture bet, and too small, too fast-growing or too founder-controlled for a control buyout. The investor usually takes a minority or structured position, uses little or no acquisition debt, and depends on the company's own growth, rather than leverage or a higher exit multiple, for most of the outcome.
The familiar comparisons, private equity vs venture capital and growth equity vs private equity, reduce to one question: what is the investor actually underwriting?
- Venture capital underwrites whether a product and a market will exist. Most positions are expected to disappoint, and a small number of outliers carry the portfolio.
- Growth equity underwrites whether a working business can scale: whether the sales motion repeats, whether margins hold as volume grows, and whether the team can run a company several times its current size. The base case is that the business survives; the open question is how far and how fast it grows.
- Buyout private equity underwrites whether an established business can generate the cash to carry debt and improve under new ownership. Control, governance changes and capital structure are the primary tools.
Why that distinction matters more in 2026 than it did a decade ago is laid out in Bain's Global Private Equity Report 2026 under the heading "12 is the new 5". The point is arithmetic. When asset prices were climbing steadily, sponsors could benefit from multiple expansion to make deals work even if operational improvements were marginal, and a typical investment required just 5% annual EBITDA growth to generate a target 2.5x multiple on invested capital over a five-year holding period. With less leverage and no multiple growth to lean on, Bain calculates that the same 2.5x over five years now pencils out only with EBITDA growth closer to 10% to 12% a year.
Time adds to the pressure. Bain reports that buyout holding periods at exit are hovering around seven years, up from an average of five to six years from 2010 to 2021, and that buyout funds are sitting on a record $3.8 trillion in unrealized value. A return that has to be earned over a longer hold, without help from the multiple, has to be earned from operations.
That is the environment growth equity was designed for. A growth investment was never supposed to depend on leverage or a rising multiple; the thesis has always been revenue and margin produced inside the company. As buyout economics converge on the same requirement, the meaningful difference between growth equity firms and buyout sponsors shifts away from capital structure and toward operating capability: who can actually help a company double its earnings, in which sector, and with what evidence that they have done it before. Bain's own prescription for the industry is that the winning firms "will build systems, not slogans" and invest in talent and AI.
03Why life sciences and healthcare, specifically
Two structural features make healthcare growth equity a distinct discipline rather than a sector label attached to a generalist strategy. First, value inflects on external events a company does not fully control: a regulatory authorization, a coverage decision, a clinical guideline, a payer contract. Second, capital intensity varies enormously between sub-sectors. A software-based care delivery company and a device company building a hospital sales force can report the same revenue and need entirely different amounts of capital, over entirely different timelines.
Medicare's Transitional Coverage for Emerging Technologies pathway shows how much of the first point is structural. TCET was designed for certain FDA-designated Breakthrough Devices. CMS anticipated accepting up to five TCET candidates per year, and for technologies accepted into the pathway its goal was to finalize a national coverage determination within six months after FDA market authorization. A dedicated federal pathway was built to target a six-month gap between authorization and national coverage, and it was sized for a handful of devices a year. CMS has since paused TCET for new candidates while it implements RAPID, a faster coverage pathway FDA and CMS announced in April 2026. For an investor, that history is a direct signal of how much of a device company's revenue timeline sits between clearance and payment, and of why regulatory approval alone rarely sets the pace of commercial growth.
In practice, the market has organized life sciences investment into five overlapping segments. They describe how capital is being allocated and how specialist teams are built, not a formal taxonomy.
Biopharma and therapeutics. The longest development timelines and the most binary clinical risk at the asset level. Growth capital here tends to favor companies with commercial or near-commercial products, platform revenue, or services businesses that support drug development, rather than single-asset clinical bets. On the buyout side, Bain notes that provider and biopharma anchored activity in 2025.
Diagnostics and precision medicine. Revenue depends on test adoption, coding, coverage and evidence of clinical utility, so a company can have a validated assay and still stall at the payer. Growth-stage value creation is often less about the science and more about the evidence and reimbursement strategy that turns a test into a standard of care. We examined that dynamic in more detail in our review of the precision medicine investment landscape.
Devices and robotics. Regulated product cycles combined with capital-heavy commercial build-outs: clinical training, field service, capital equipment sales and coverage work. Medtech buyout deal value nearly doubled in 2025 to an estimated $33 billion, which gives growth-stage device companies a clearer set of eventual buyers than they had a few years ago.
Digital health and delivery. The segment closest to software economics, and the one where the performance bar has moved fastest. Bain observes that the Rule of 40, which holds that annual revenue growth plus EBITDA margin should exceed 40%, has long been the gauge for software businesses, and that top-performing healthcare IT businesses now exceed 60% on this metric.
Longevity and neuro. The least mature of the five as a growth-stage market. Much of the underlying science is still pre-commercial, so the investable growth opportunities tend to be businesses with revenue today, such as clinical services, diagnostics and devices, that sit on top of that science rather than depending on it alone.
The segments overlap. A neuromodulation device belongs to devices and to neuro; an algorithmic diagnostic is also a software business. The value of the segmentation is that each has a different regulatory path, reimbursement logic and capital curve, which means a single underwriting model applied across all five will misprice at least some of them.
04AI as an accelerant, not a category
The venture data explain why this distinction matters. When the overwhelming majority of US venture dollars flows to AI companies and $100 million-plus financings, the label itself becomes a fundraising tool, and "AI healthcare" as a standalone bucket becomes easy to claim and hard to evaluate.
The more useful view is that AI shows up inside each of the five segments, as a change in unit economics or in the time it takes to produce evidence:
- Diagnostics and precision medicine. The FDA maintains an AI-Enabled Medical Device List identifying AI-enabled devices authorized for marketing in the United States. On the version current as of September 4, 2026, the list carries more than 1,600 entries, roughly three-quarters of them in radiology, authorized through 510(k), De Novo and premarket approval submissions. That is AI as a regulated product feature, not a pitch-deck theme.
- Biopharma and therapeutics. Computational tools for target selection, molecule design and trial design, where the value appears as fewer failed experiments and faster, better-targeted enrollment rather than as a separate revenue line.
- Devices and robotics. Perception, guidance and planning software intended to improve procedural precision and consistency, which changes what a robotic system can do without changing the hardware.
- Digital health and delivery. Triage, clinical documentation and revenue cycle automation. Bain finds leading investors reaching Rule of 60 outcomes through pricing and packaging, cross-selling, and AI-enabled growth and margin expansion, as end-user adoption is no longer enough to generate strong returns.
- Longevity and neuro. Biomarker discovery and signal processing across large imaging and physiological datasets, where models help turn noisy measurements into usable clinical endpoints.
For allocators, this suggests a simple test of any manager's AI thesis: ask to see it company by company. If AI is a genuine accelerant, each portfolio company should be able to name the specific workflow, the metric it moves (gross margin, time to clearance, cost per test, clinician hours), and the evidence that the metric moved. If the thesis lives mainly in the strategy narrative and disappears at the company level, it is a label layered onto a generic healthcare portfolio. We set out a fuller version of this lens in our playbook on how growth equity firms apply AI in healthcare.

05Where the market is inefficient: the mid-market growth equity gap
Both adjacent capital pools are moving toward size. Venture dollars are concentrating in AI and nine-figure rounds. Buyout value is concentrating in megadeals: Bain counts 13 deals in the $10 billion-plus bracket that accounted for $274 billion of the global gain in 2025, and healthcare buyout value was powered by large transactions. When the capital on both sides skews large, the middle is the natural place to look for a supply gap.
For this study, the mid-market gap means life sciences and healthcare companies with roughly $10 million to $50 million in revenue. That is a working range for analysis, not an official definition. Companies in that band typically share four traits:
- They need more capital than most early-stage venture checks provide, but far less than the minimum equity check of a large buyout fund.
- They rarely have the stable, predictable cash flow that supports acquisition debt, because revenue is still growing and being reinvested.
- Founders often retain control and intend to keep it, which rules out a control transaction on terms they would accept.
- Their next stage of value depends as much on operating work, such as a commercial build-out, a reimbursement strategy, a manufacturing scale-up or a first acquisition, as on the money itself.
Our State of Growth Equity research measures a closely related shortage from the financing side: checks of roughly $5 million to $25 million into companies valued at $50 million to $300 million.
A classic control-oriented model of mid-market private equity, which relies on debt capacity and governance control, fits these companies poorly. So does a venture model built around portfolio outliers, because these businesses are past the stage where a power-law bet is the right frame. We described why the middle market rewards a different approach in our piece on the middle-market sweet spot.
This is where operator-led growth capital, meaning capital paired with people who have run the relevant functions inside companies, has a structural edge. In this band the scarce input is often judgment about a specific operating problem rather than money. A diagnostics company with a validated test and flat adoption usually does not need a larger sales force; it needs an evidence and coverage strategy. A device company with clearance does not need a bigger marketing budget before it has a payment path. Investors who have solved those problems before can shorten the distance between a proof point and scaled revenue, and they can price risk more accurately because they recognize which problems are solvable and which are not.
The same fact explains why the gap persists. Operator depth in a regulated sector is slow to build and hard to scale, while capital alone is abundant at both ends of the market. Longer holding periods raise the value of that depth further. An investor who enters earlier on a company's commercial curve has more of the curve to work with, and more execution risk to manage, and operating expertise is how that risk gets managed rather than merely diversified.
06What this means for allocators evaluating healthcare growth equity
For allocators assessing growth equity exposure in life sciences and healthcare, the data translate into a short list of questions. None requires a view on the cycle. Each tests whether a strategy is built for the sector's actual mechanics:
- Sector specialization versus generalist mandate. Does the team underwrite regulatory and reimbursement risk itself, or does it rely on outside advisers for the questions that decide value? Ask how recent investment decisions treated FDA and coverage timelines, and what happened when those timelines slipped.
- Operating bench strength. Who does the operating work after closing, what have they run before, and how much of their time is committed to portfolio companies? A roster of advisers is not a bench.
- Check-size discipline. Does the check size match the band the strategy claims to serve? A strategy that describes the mid-market gap but deploys most of its capital into larger, later rounds has drifted toward the crowded ends of the market.
- How the manager talks about AI. Is AI visible company by company as a change in margins, speed or evidence, or does it exist mainly as a strategy-level theme? Apply the portfolio test described above.
- Segment fluency. Can the team explain why a diagnostics company and a digital health company with identical revenue need different capital and different time? Capital intensity and regulatory path should show up in reserve planning, not only in presentation materials.
- Honesty about the data. Because life-sciences-only growth equity is not broken out in the major public benchmarks, any manager citing a market size should say which data it rests on. Buyout totals and venture totals are context, not a proxy for the growth equity opportunity set.
The 2025 and 2026 data describe private capital markets that are larger than ever and more concentrated at both ends. For life sciences and healthcare, the more consequential development is the one the aggregates do not show directly: a band of commercially proven companies whose next stage depends on capital and operating judgment arriving together. That band, and the investors equipped to serve it, is where the substantive work in healthcare growth equity now sits.
07Frequently asked questions
What is growth equity investing?
Growth equity is investment in companies that have proven product-market fit and generate meaningful revenue, often profitably or close to it, but need capital to scale through commercial expansion, acquisitions or operational build-out. Investors usually take minority or structured positions and use little or no acquisition debt, so the outcome depends mainly on the company's own growth rather than on leverage or a higher exit multiple.
How is growth equity different from venture capital and private equity?
Venture capital takes minority stakes in unproven companies and expects a few outliers to drive results. Buyout private equity acquires majority or full control of established businesses, often using debt. Growth equity sits between them: minority or structured positions in companies with proven revenue, little leverage, and a working partnership with existing management, where results depend on scaling execution rather than product discovery or financial engineering.
Why is growth equity capital flowing into life sciences and healthcare right now?
The clearest measured signal comes from adjacent markets. Bain reports that healthcare private equity reached a record high in global deal value in 2025, with provider and biopharma anchoring activity and healthcare IT gaining share. Buyout returns now require much faster operating growth, which favors investors who build companies rather than rely on leverage. Growth equity itself is not reported as a separate healthcare series.
What sectors within healthcare are attracting the most growth equity capital?
Sector-level growth equity figures are not published, but capital is organized around five overlapping segments: biopharma and therapeutics, diagnostics and precision medicine, devices and robotics, digital health and delivery, and longevity and neuro. In Bain's 2025 buyout data, biopharma deal value reached an estimated $80 billion, provider services $62 billion and medtech $33 billion. AI runs across all five rather than forming its own category.
How big is the growth equity market in life sciences?
The major public benchmarks do not break out life-sciences-only growth equity, so treat any precise figure with caution. The adjacent markets show the scale: US startups raised more than $400 billion in the first half of 2026, and Bain estimates 2025 healthcare private equity deal value above $190 billion. Growth equity's share has to be inferred from those edges.
What risks should investors weigh in life sciences growth equity?
Three stand out. Regulatory and reimbursement timelines, such as FDA authorization followed by payer coverage, can delay revenue regardless of how well a company executes. Capital intensity differs sharply by segment, so a device company and a software-based care company with equal revenue may need very different funding. And many growth-stage companies need operating expertise, not only capital, to turn clinical or technical proof into scaled commercial revenue.
Nothing in this piece is investment, legal, tax or accounting advice, and nothing in it is an offer to sell or a solicitation of an offer to buy any security.
Former Chairman of JumpStart Inc. He has founded, scaled and exited companies across media, nutrition, real estate and human-resources technology, and owned the revenue line in every one of them. What he brings to a position is that operating experience at scale, investment acumen, an advanced diligence capability, and technology and artificial-intelligence expertise. He invests the way he operated: inside the business, on the plan, alongside the management team.